Rocky Mountain/Boulder Simulation
This page describes a numerical simulation of gravity waves over the Rocky Mountains.
First run of Boulder Event.
Computational Domain
The layout of the of the simulation is shown in the figure below. The origin is located at
Boulder (40.0° N, 105.25° W). The uniform region is shown by the black rectangle.
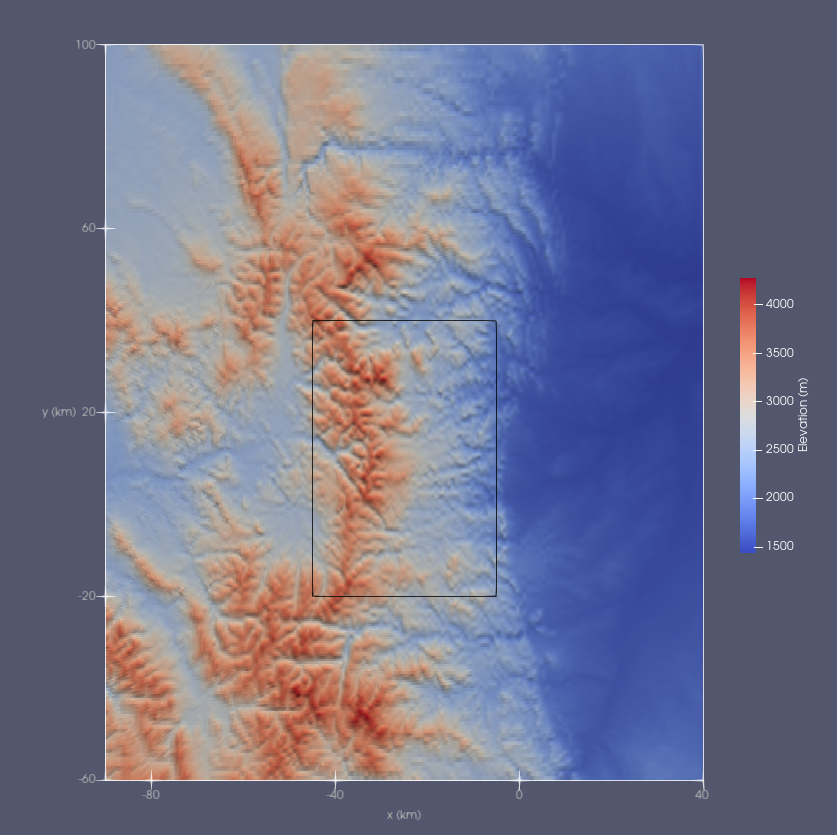
In the uniform region, the computation grid uses horizontal mesh spacings of 250 m and the vertical grid uses a spacing of 100 m up to an altitude of 15 km. The mesh is then stretched gently to the boundaries. Inviscid wall boundary conditions are used and the surface whereas characteristic (radiative) conditions are used at the lateral and top boundaries with a sponge layer. This simulation has a total of 320x400x220 points.
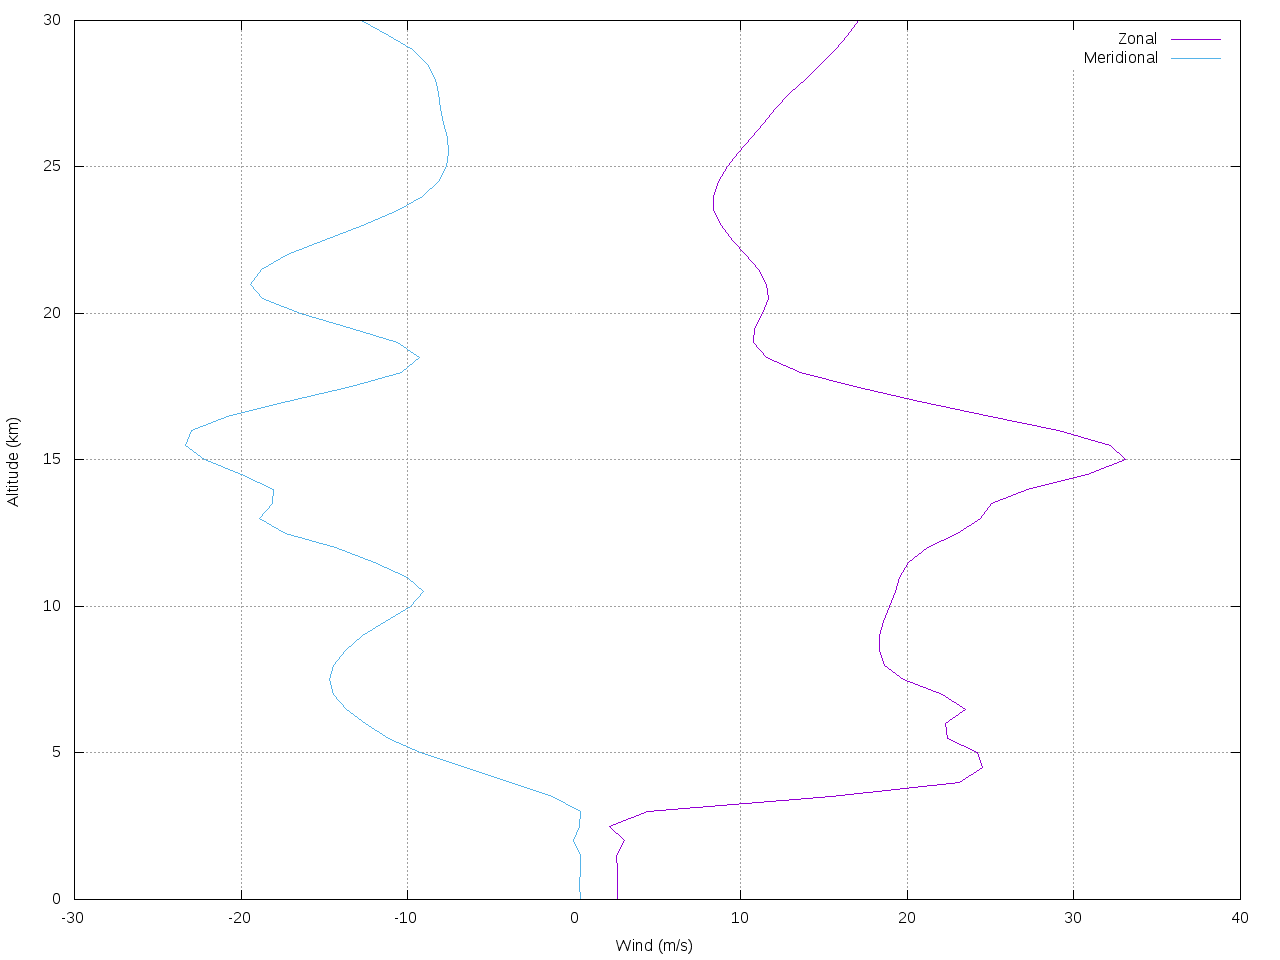
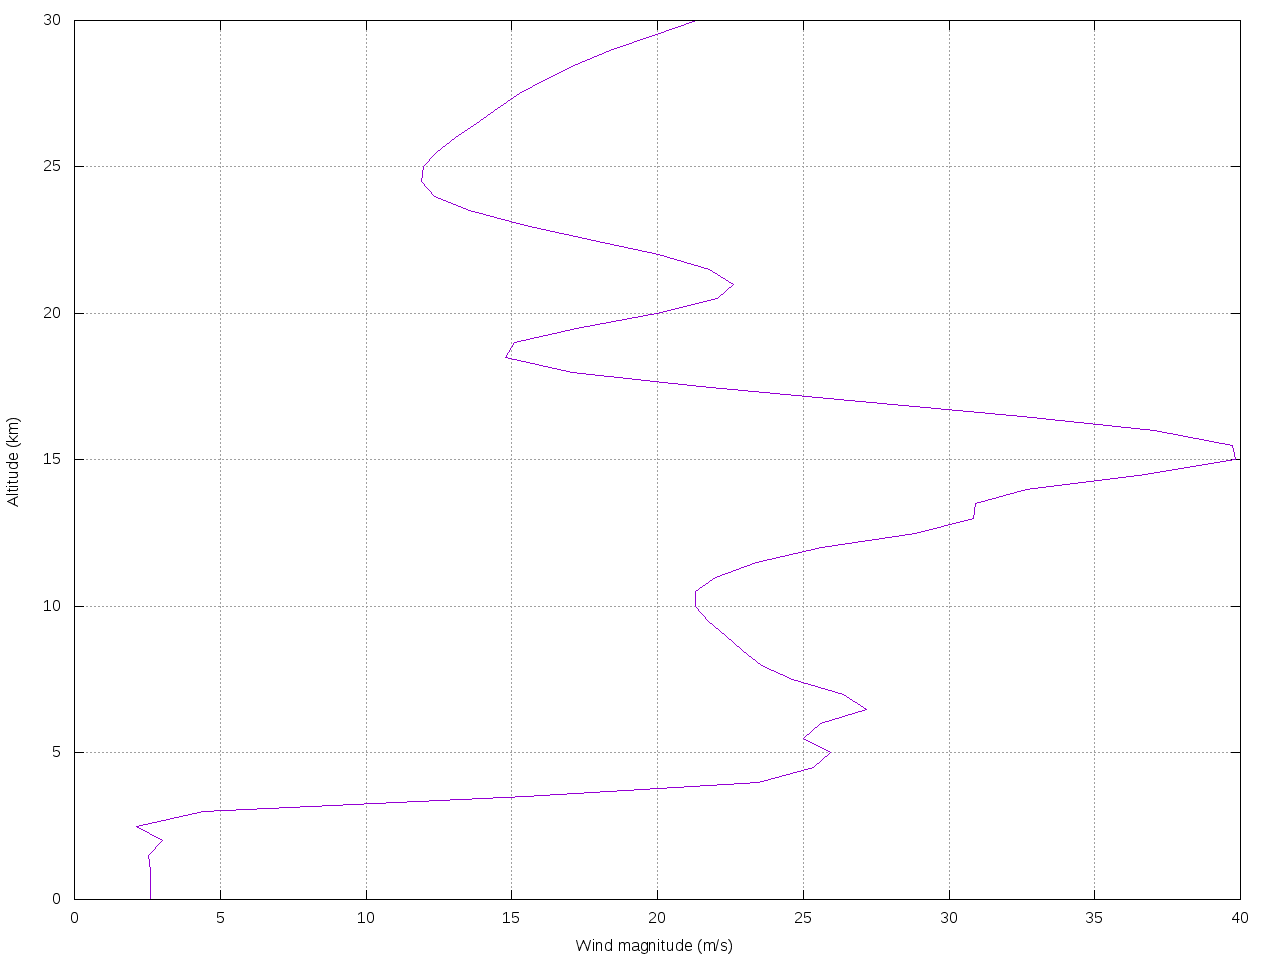
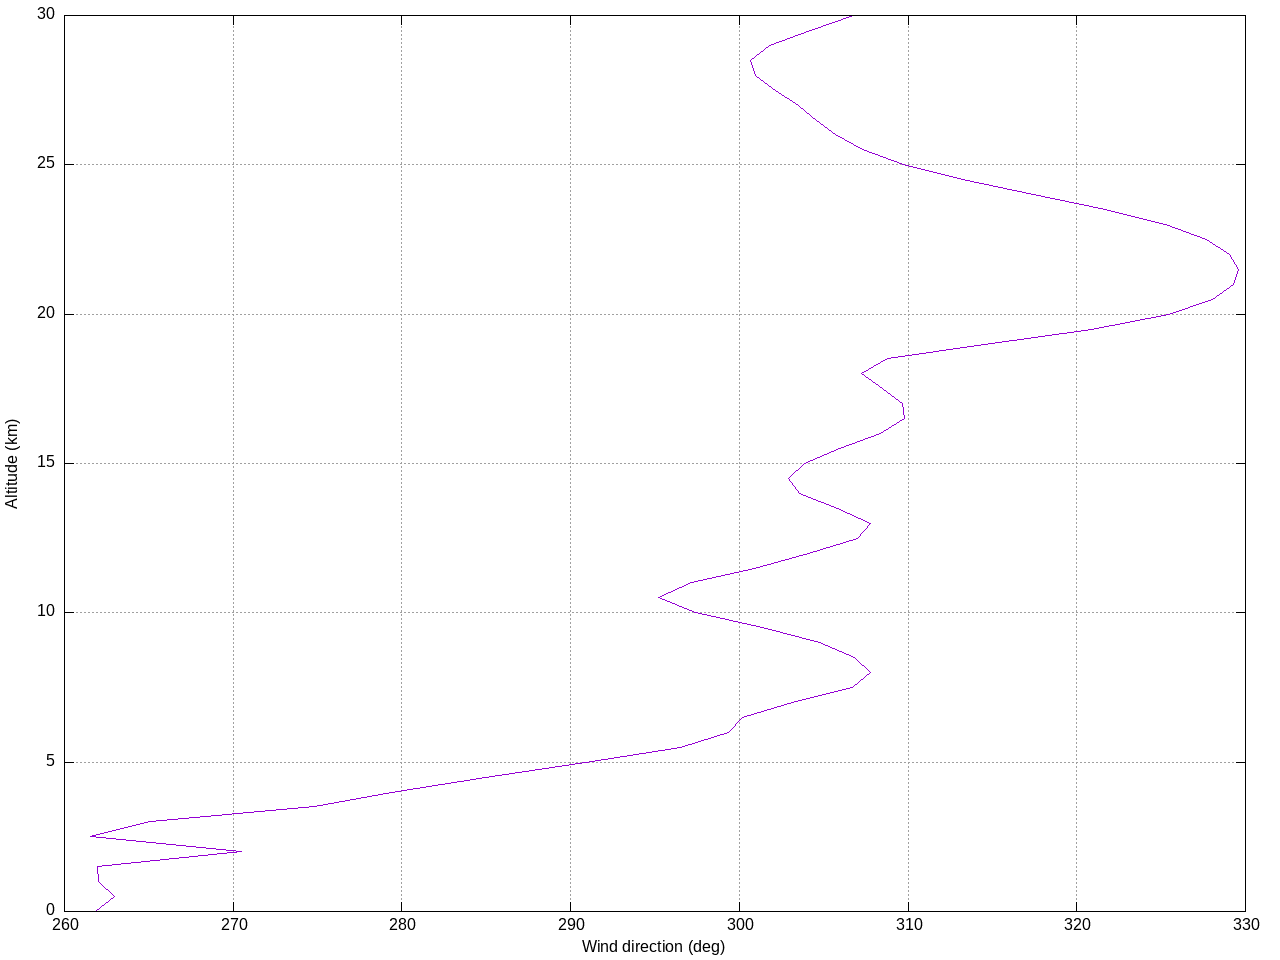
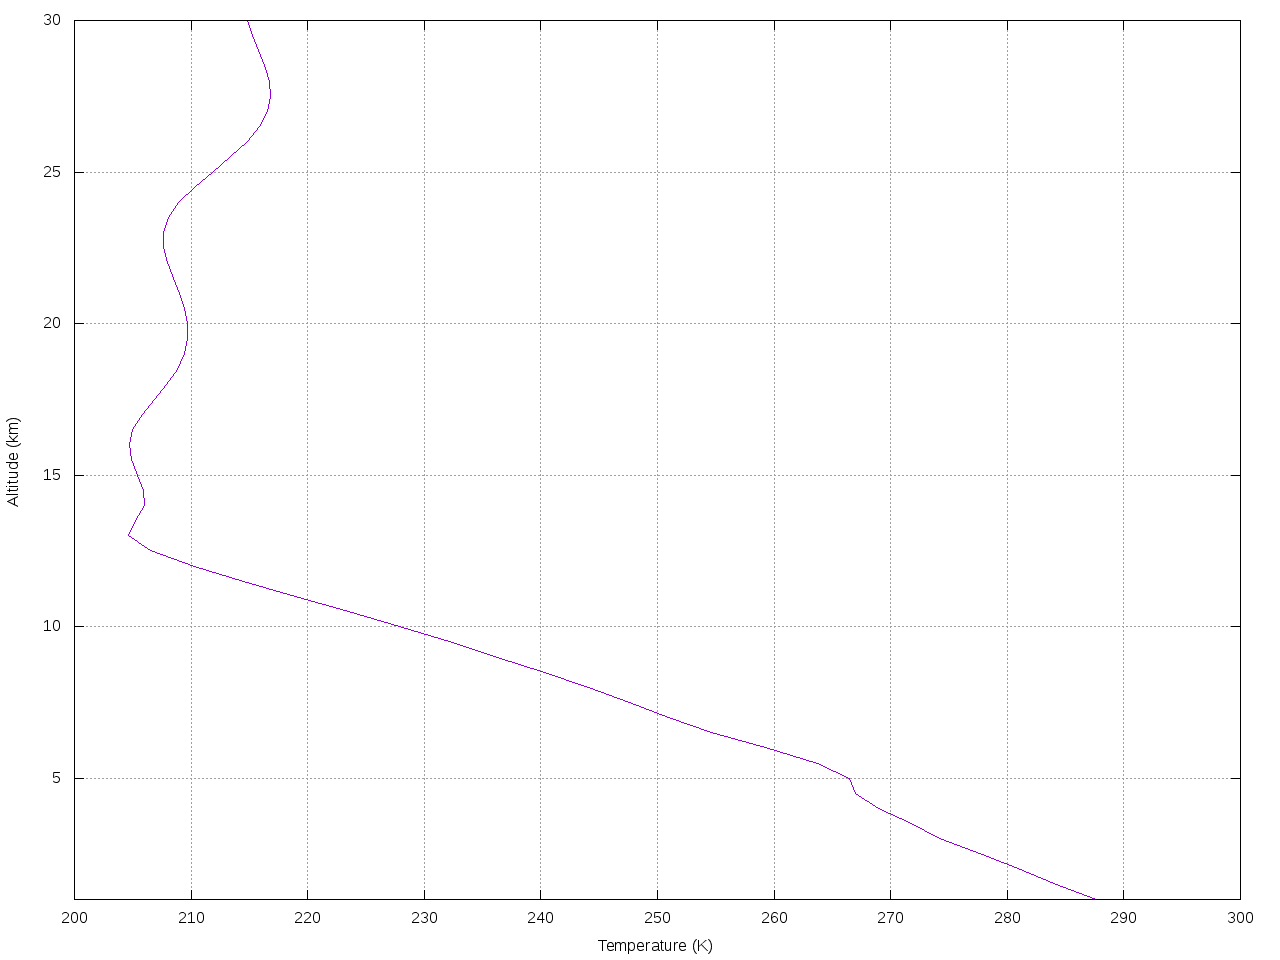
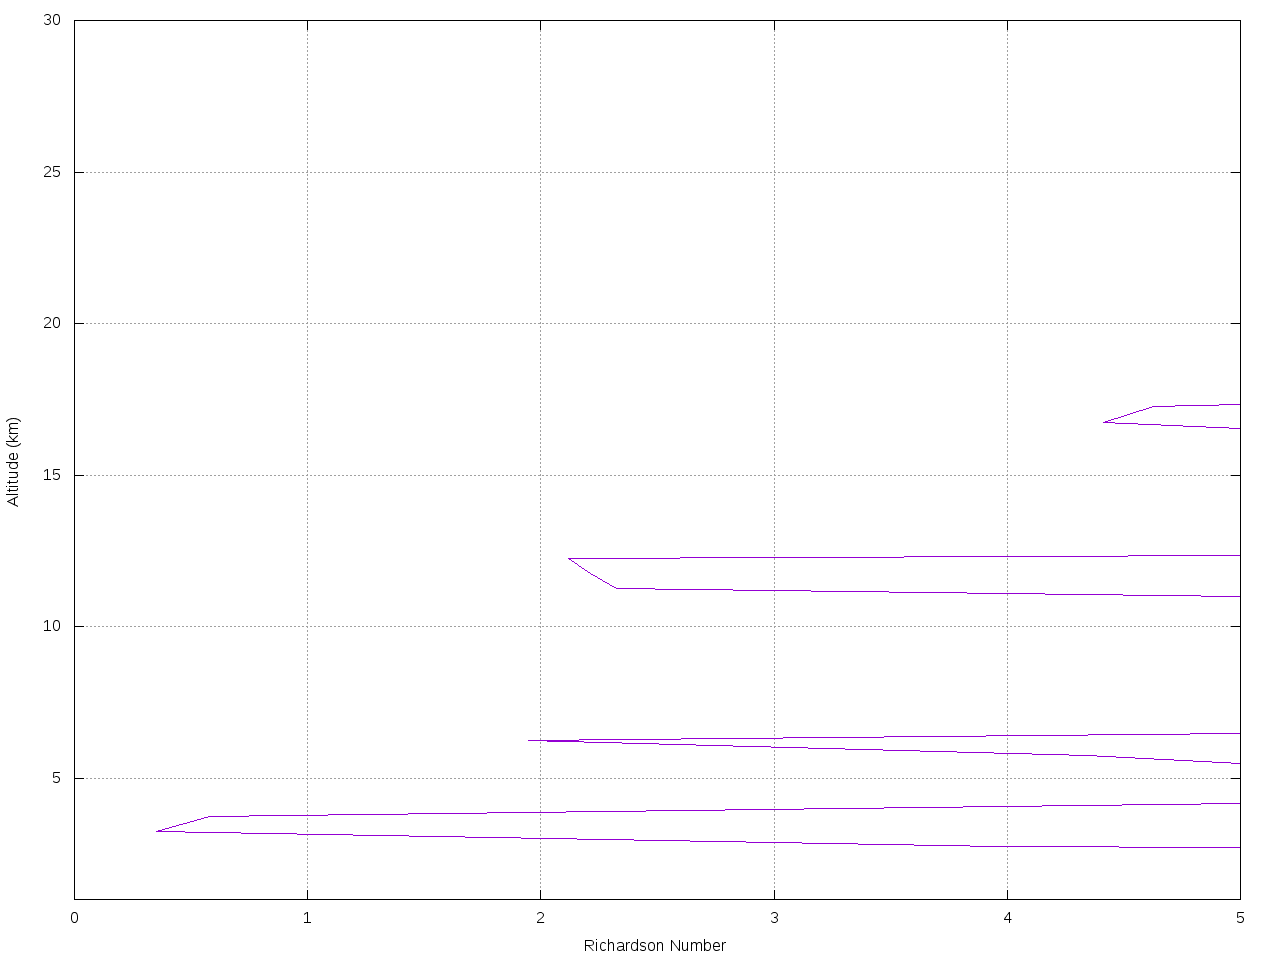
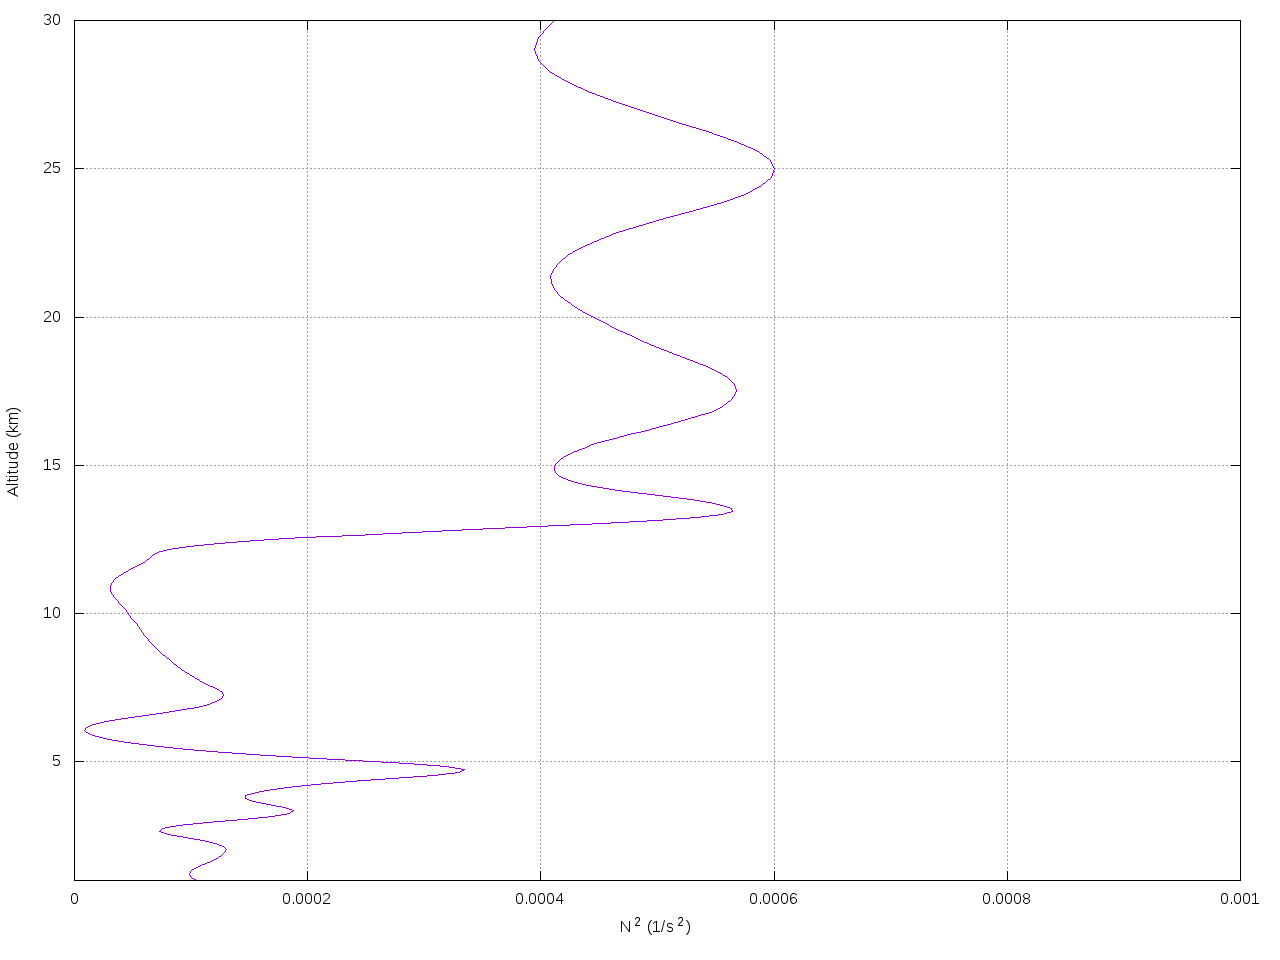
Wind Profiles
The background is fixed in space and time, taken using ERA5/GFS data located at
(40.25° N, 105.75° W), close to Long's Peak.
Forcing
In order to minimize starting transients, the mean winds are damped to zero
near the surface. Forcing terms are then used to increase the
near-surface winds over a period of four
hours. The forcing terms follow a hyperbolic tangent function in time, which
results in very gentle accelerations near the beginning and end of the forcing
period. The maximum forcing rate is equivalent to that of a linear ramp
with a duration of one hour.Animations in xz planes at y=0
Animations in yz planes at x=0
Animations in xy planes
Note that these planar representations are distorted according to the underlying terrain.
The vertical grid fades out the elevation to an eventually cartesian grid at 15 km.
The actual elevation of these planes is on average
higher than the labeled elevation. An elevation contour at 3200 m is outlined in the subsequent animations.